2. Main interface
2.1 Sign In and Sign Out
- sign in web site
Enter the IP address and port number of the device in the browser address box (for example: http://192.168.14.176:10003/openatc) to enter the web client login interface. Enter the user name and password to enter the client.
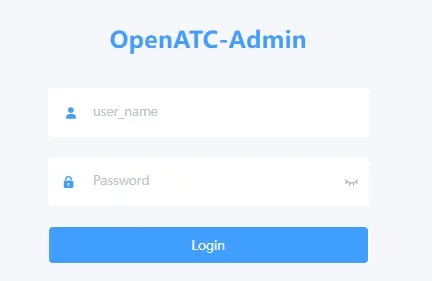
After successfully logging in for the first time, enter the main interface of the system.
- sign out web site
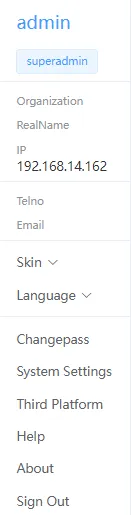
Click the triangle icon button under the user account in the upper right corner of the client operation interface and click "Logout" to log out safely.
2.2 Changepass
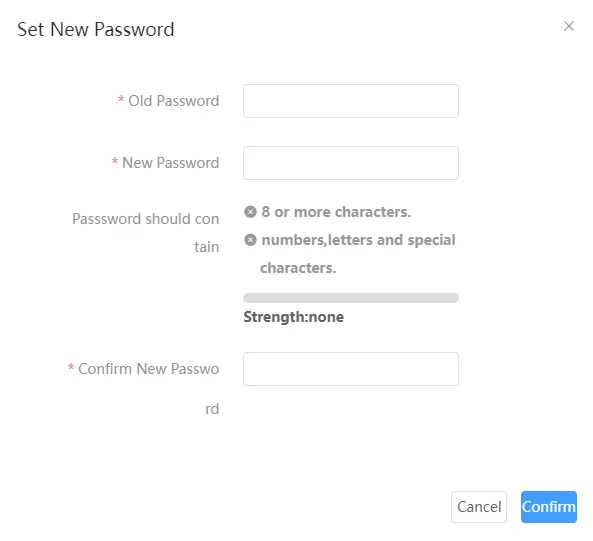
Click the triangle icon button under the user account in the upper right corner of the client operation interface, and select "Modify Password" from the drop-down menu, and the password modification menu will pop up.
Notice:
-
In order to improve the security of product network usage, it is recommended that you set a strong password. The password must be 8-16 characters long and must be a combination of at least two or more types of numbers and letters or special characters.
-
Please change the password of the user name regularly. It is recommended to update the password every 3 months. If the device is used in a higher security risk environment, it is recommended to update it monthly or weekly.
-
Please keep your username and password in a safe place.
2.3 Language Switch
Click admin-language triangle icon button in the upper right corner of the client interface to switch to Chinese interface.
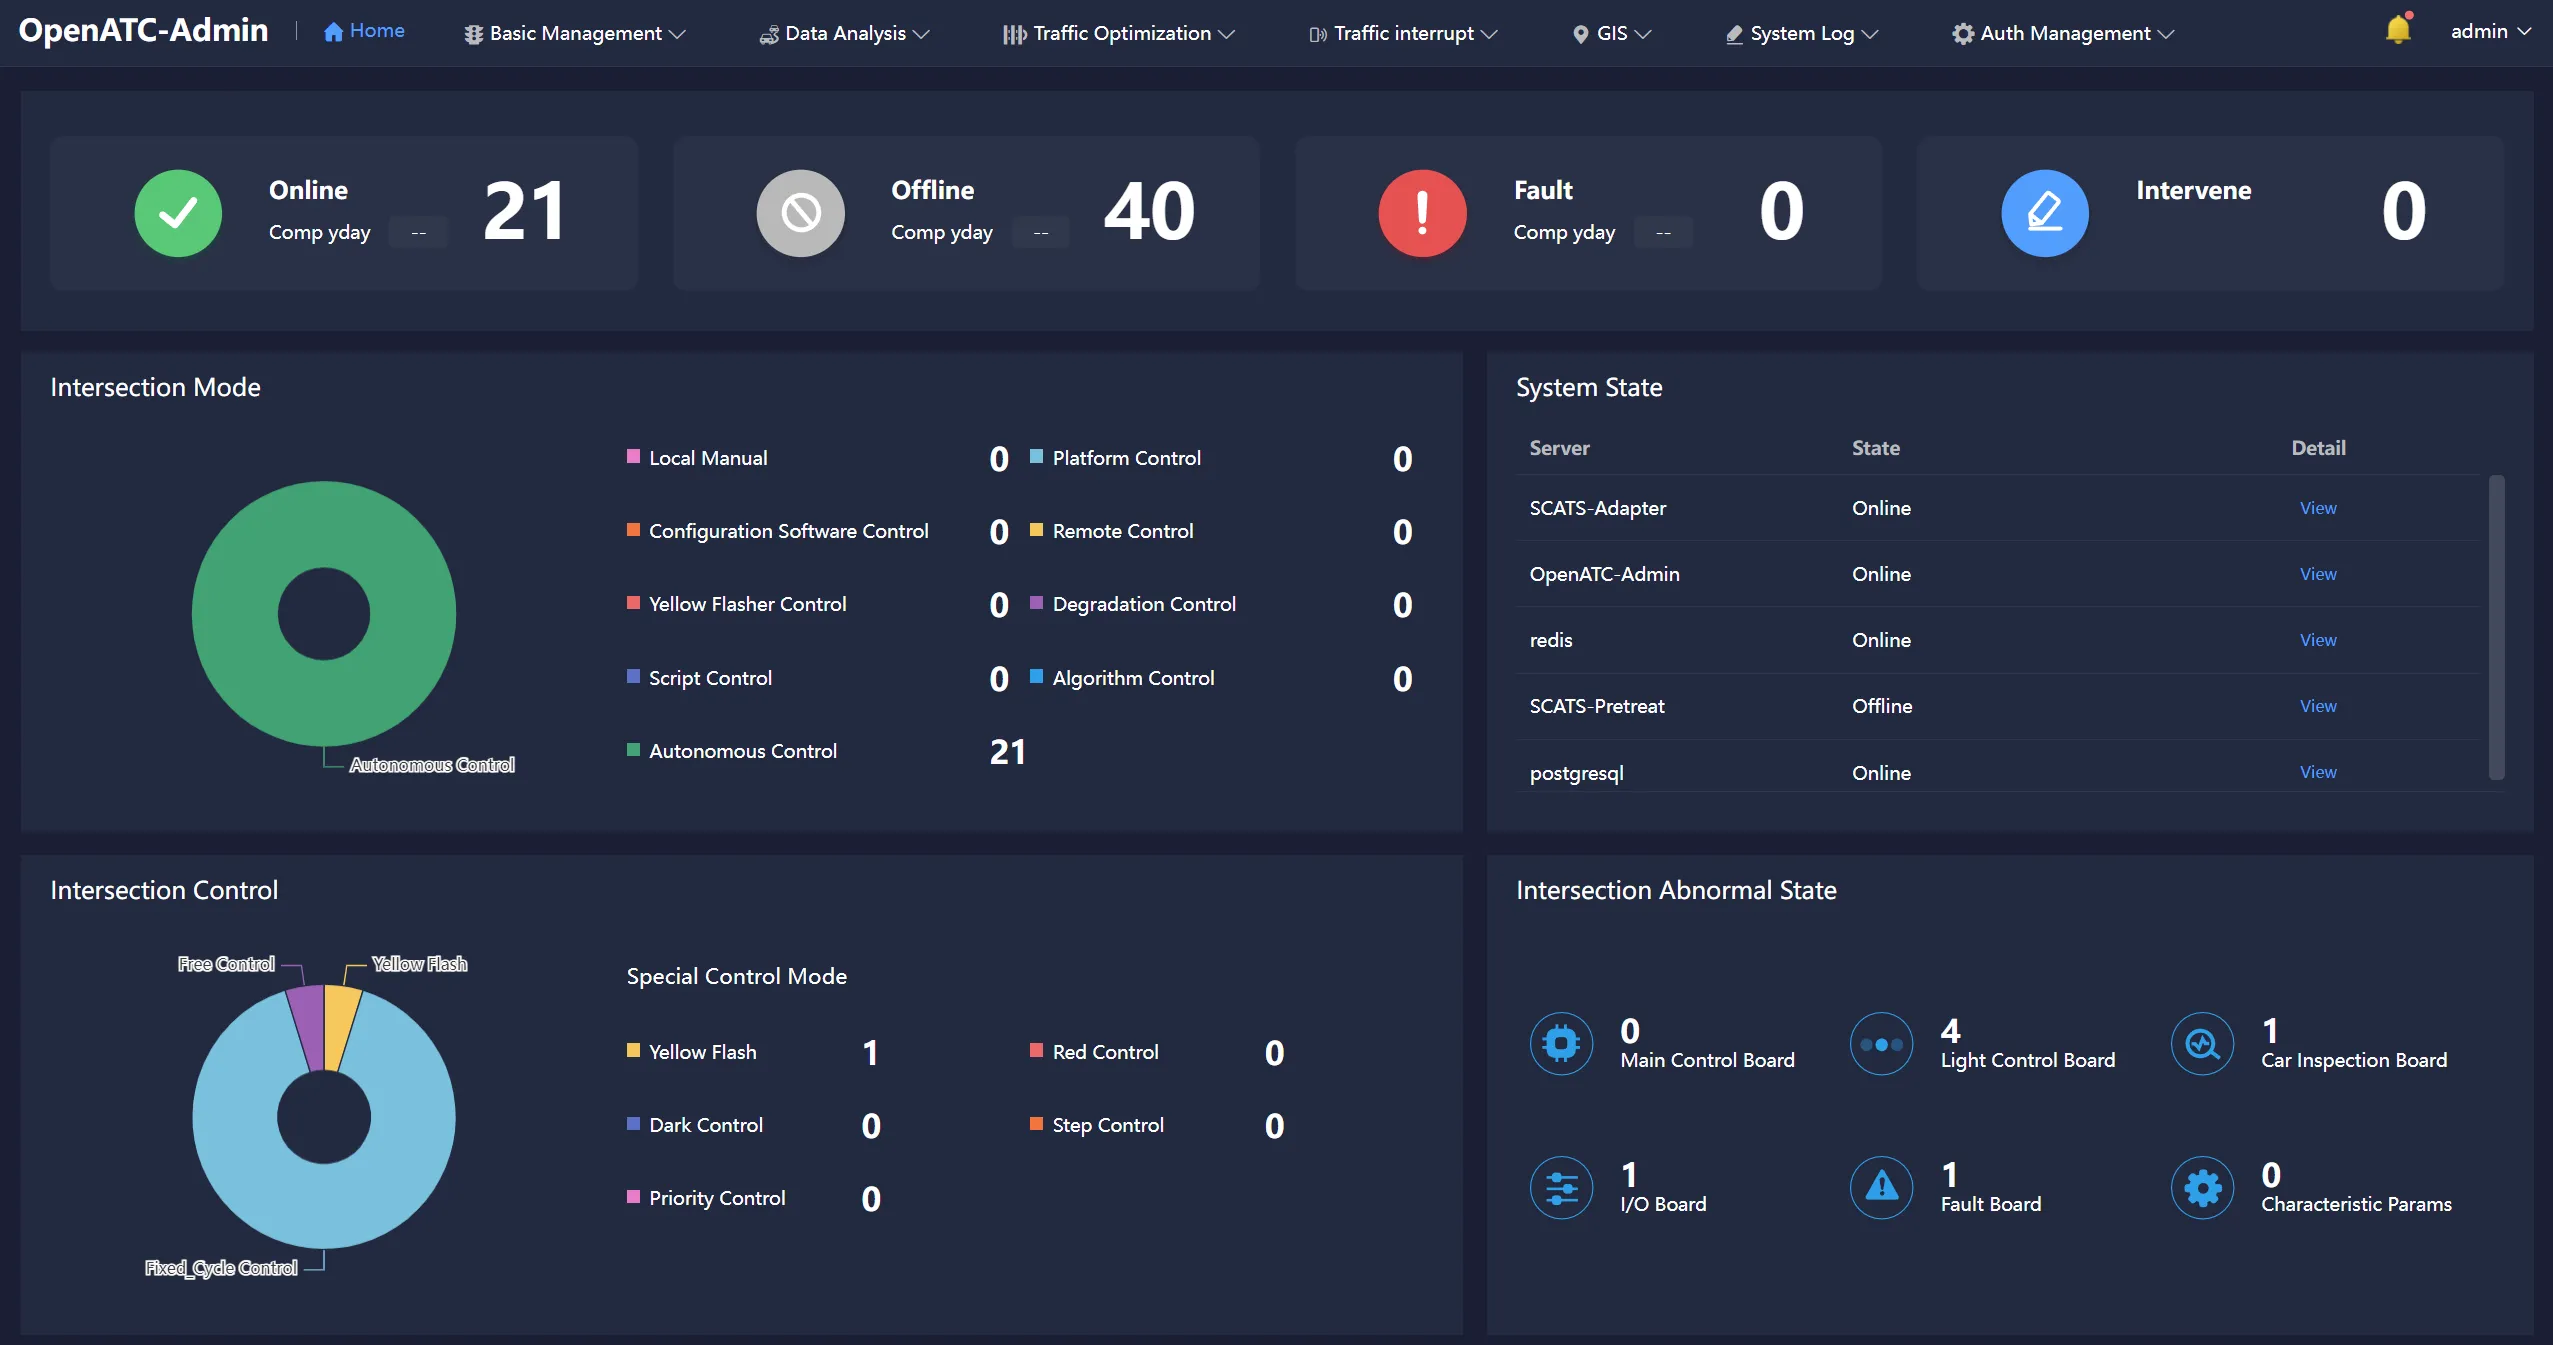
2.4 Theme Switching
Click admin-skin triangle icon button in the upper right corner of the client interface to switch to dark color style.
2.5 System Settings
Click the admin-system setting button in the upper right corner of the client operation interface. The system setting displays the information of the current module, including module, name, module content and module description.
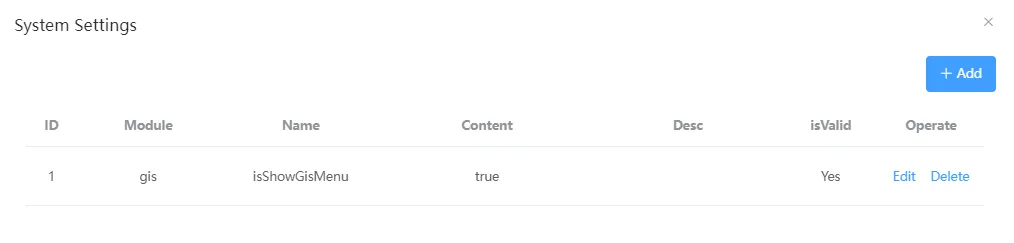
2.5.1 Add Config
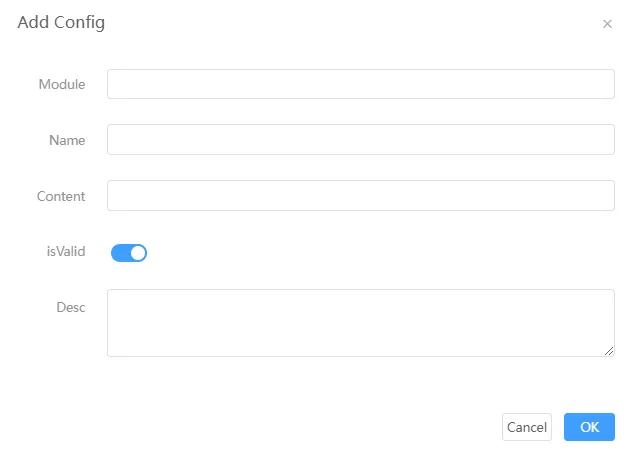
Enter the module, name, content, and description of the module, select whether the configuration is enabled or not, and then click OK.
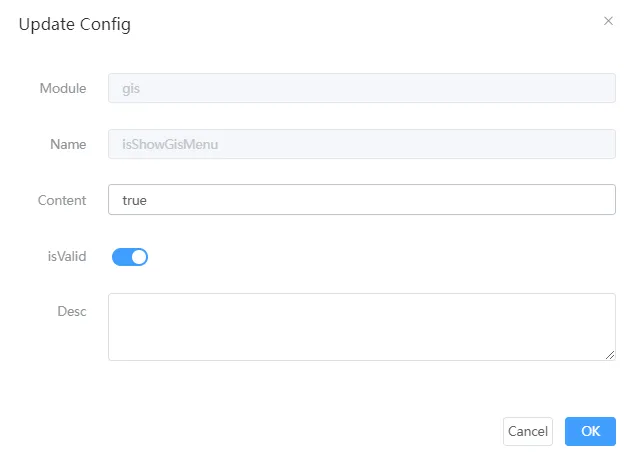
2.5.2 Edit Config
Modify module information.
2.5.3 Delete Module
Select the corresponding module and click Delete.
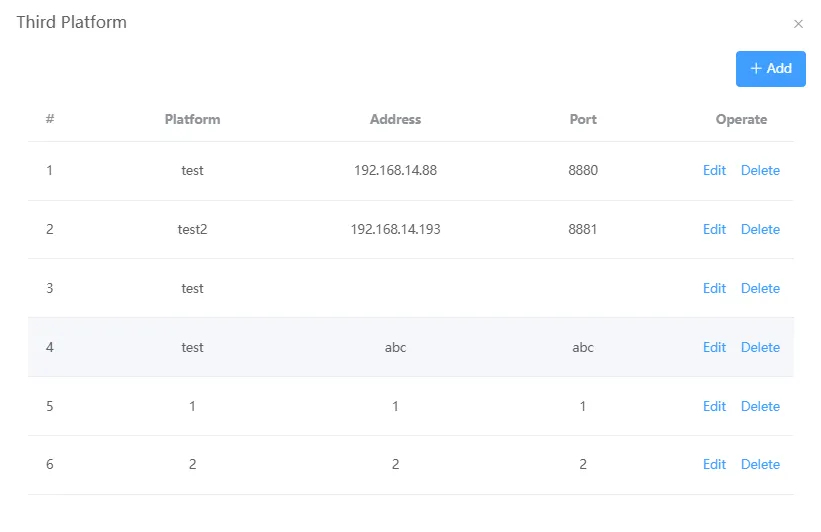
2.6 Third Platform
Click admin-third platform in the upper right corner of the client interface interface to view the corresponding IP addresses and ports of each platform, and you can edit and delete operations.
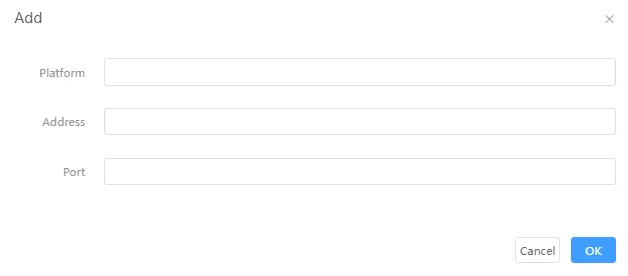
2.6.1 Add Module
Click the "Add" button in the upper right corner, enter the name, address and port number of the third-party platform, and click "OK" to add it.
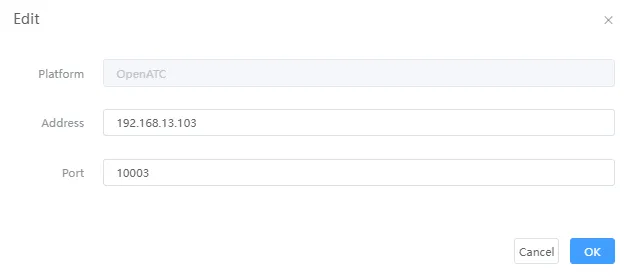
2.6.2 Edit The Module
Click the "Edit" button on the right side of each platform to modify the corresponding address and port number.
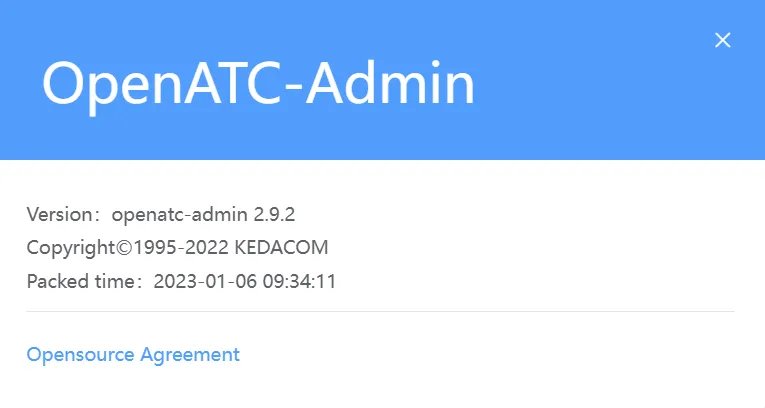
2.7 About
Click the admin-about button in the upper right corner of the client operation interface, about the main version of the software, copyright, online time, etc.
2.8 Help
Click the admin-Help button in the upper right corner of the operation interface of the client to view the corresponding user manual. If the language is "Chinese", the Chinese user Manual interface will pop up. If English is selected, the English user Manual page is displayed.
2.9 Fault Center
Click the icon  in the upper-right corner to view the list of reported alarm information. Alarm information includes: Reporting Module, Road Name, Event Type, and Detailed Description.
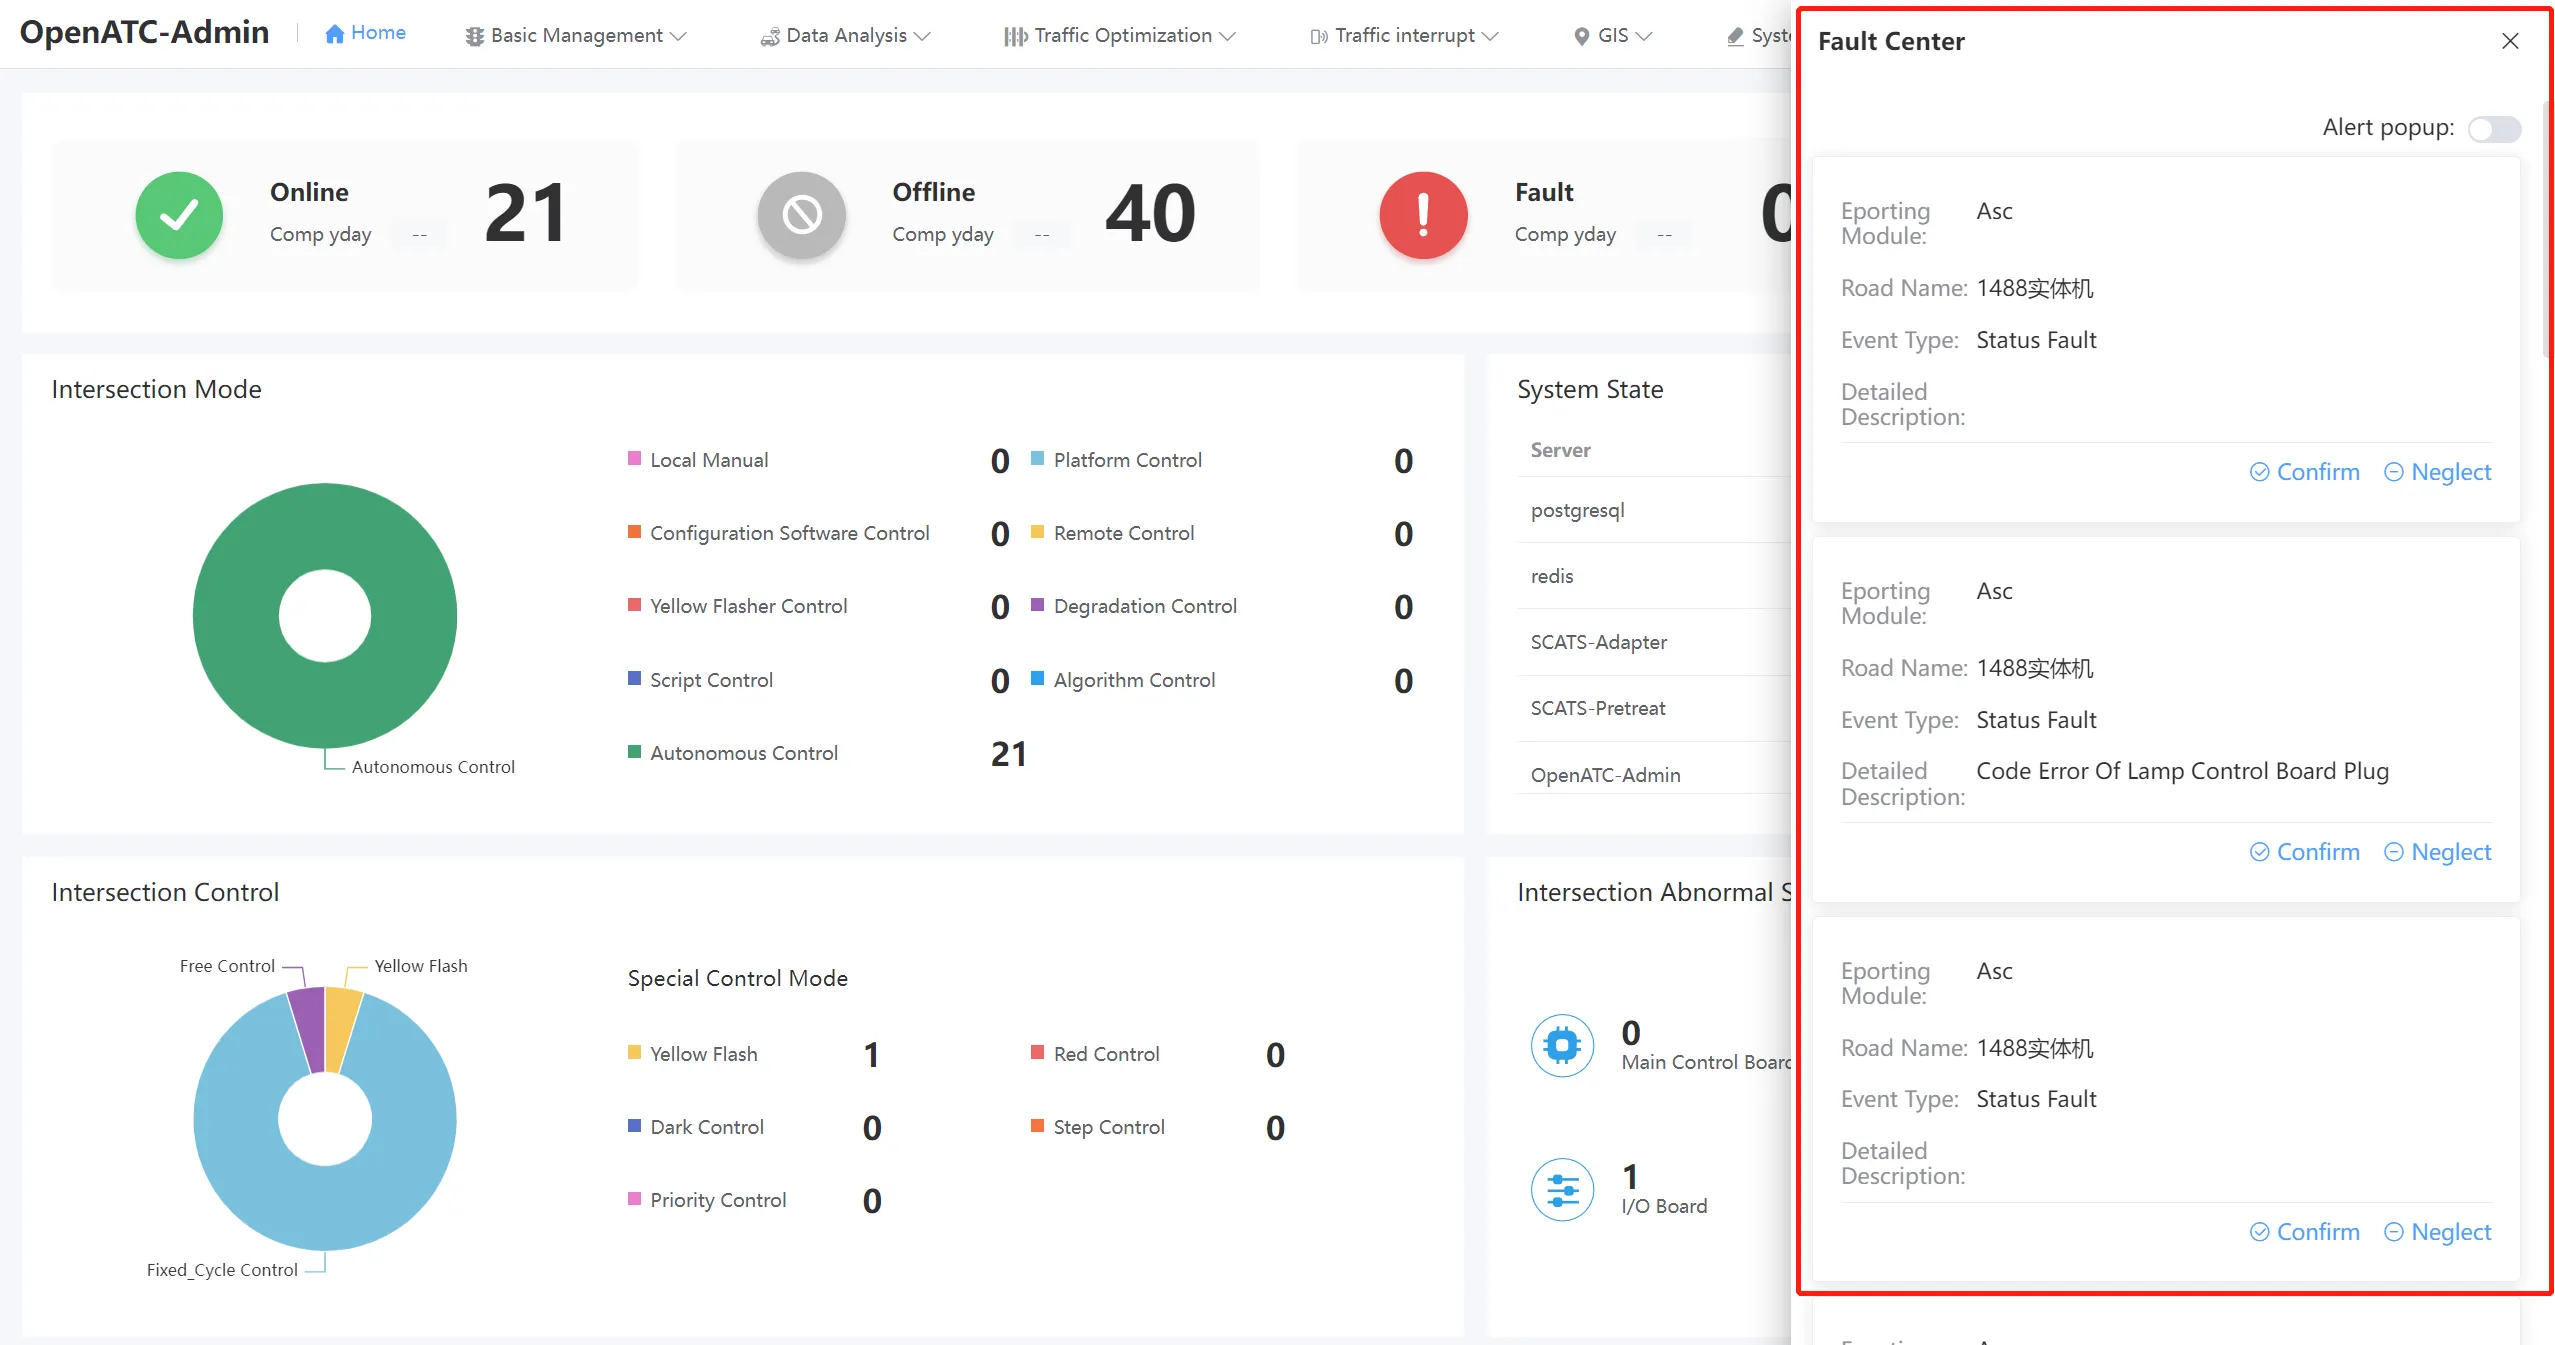
Click the pop-up window switch at the top right of the alarm information list to see the real-time alarm pop-up window in the lower right corner of the interface. You can select Confirm or Ignore the alert message.
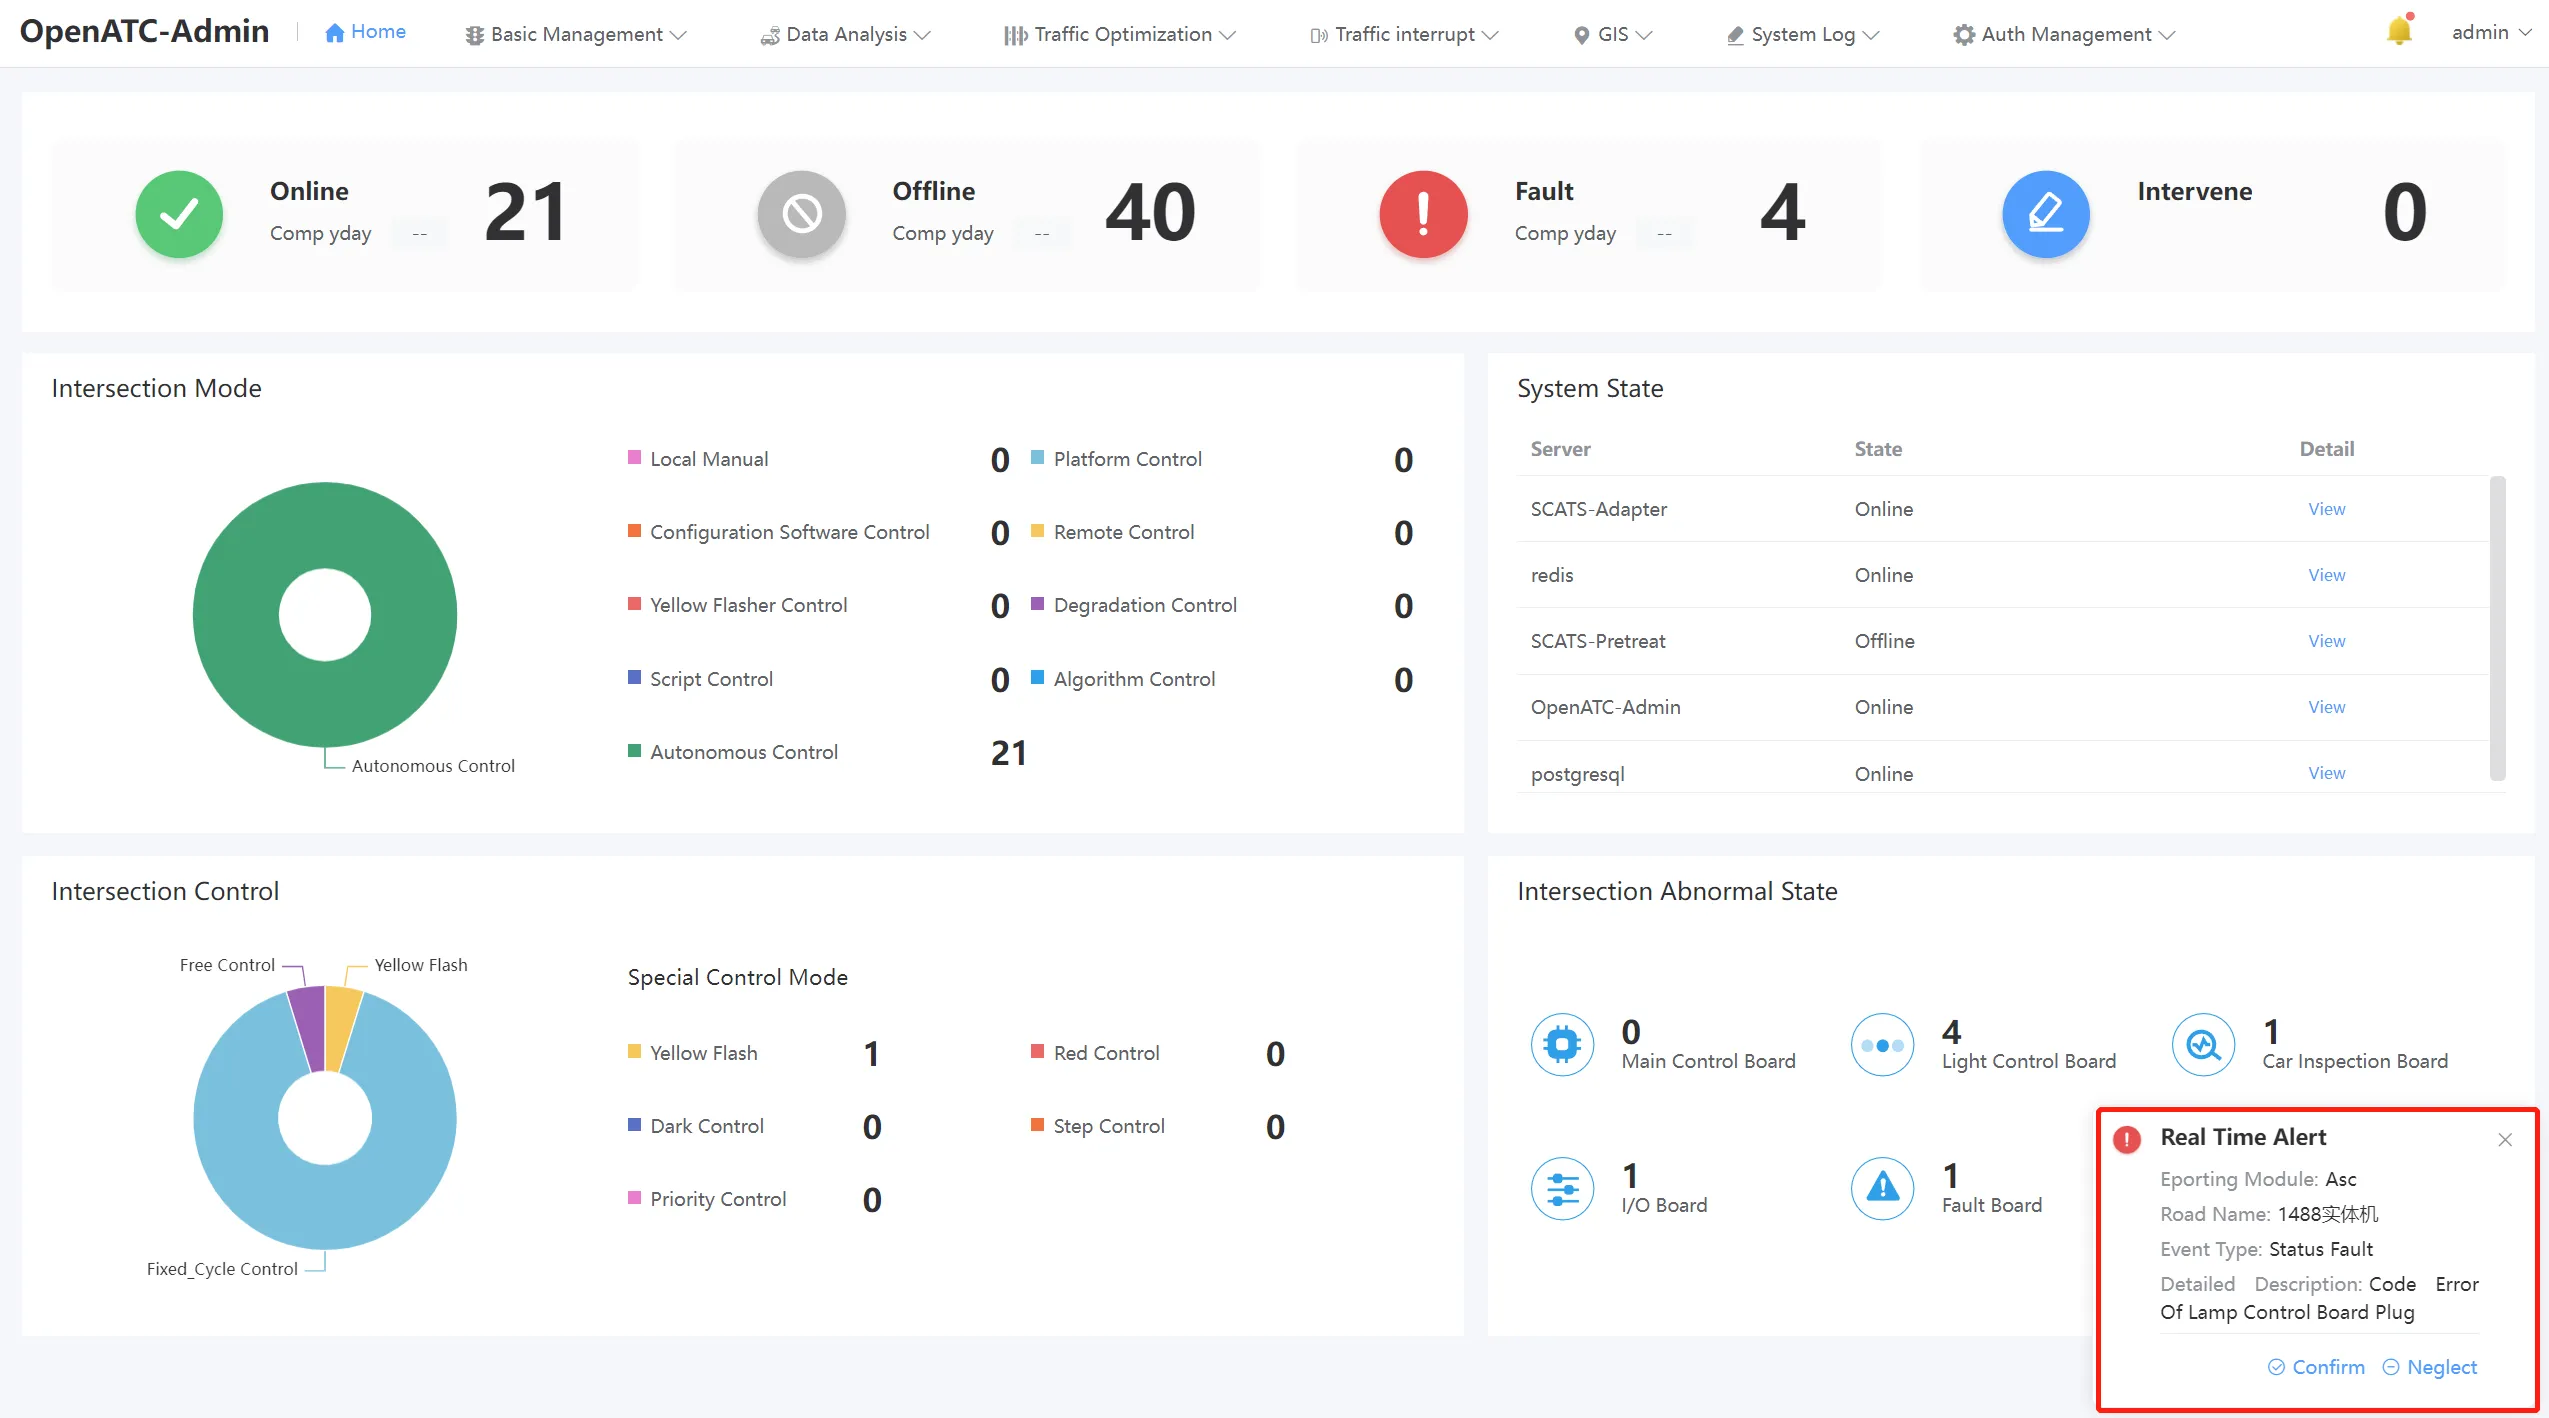
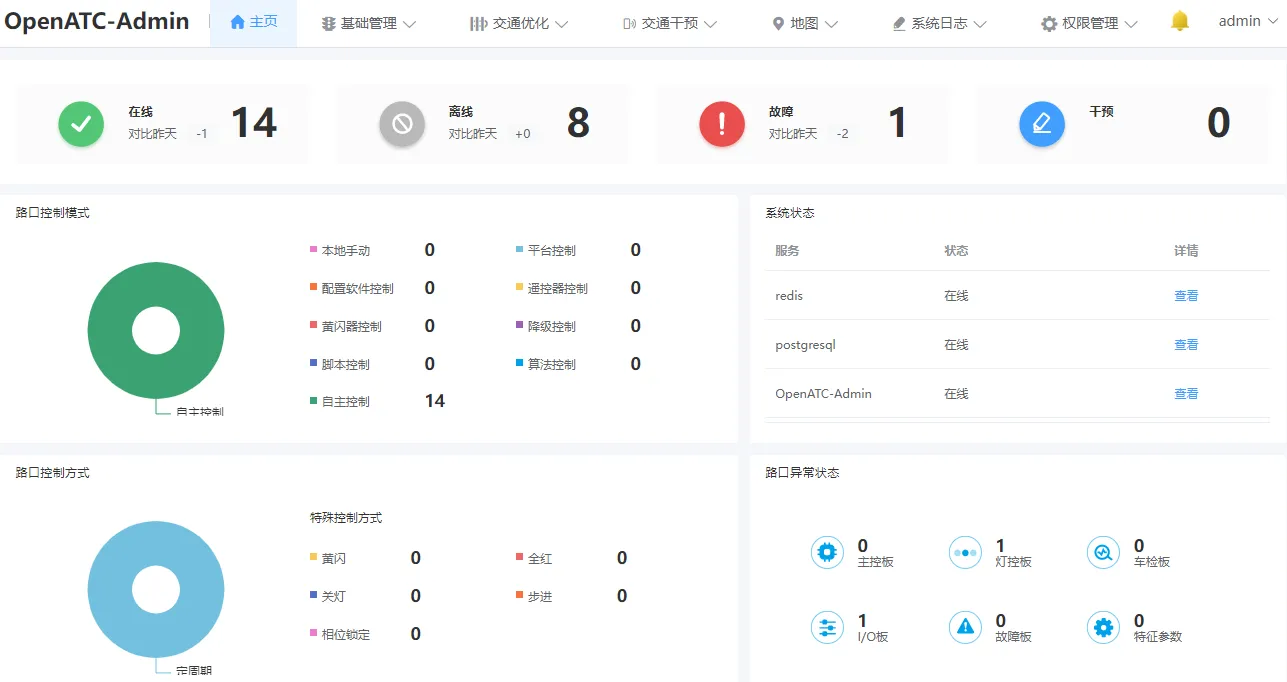
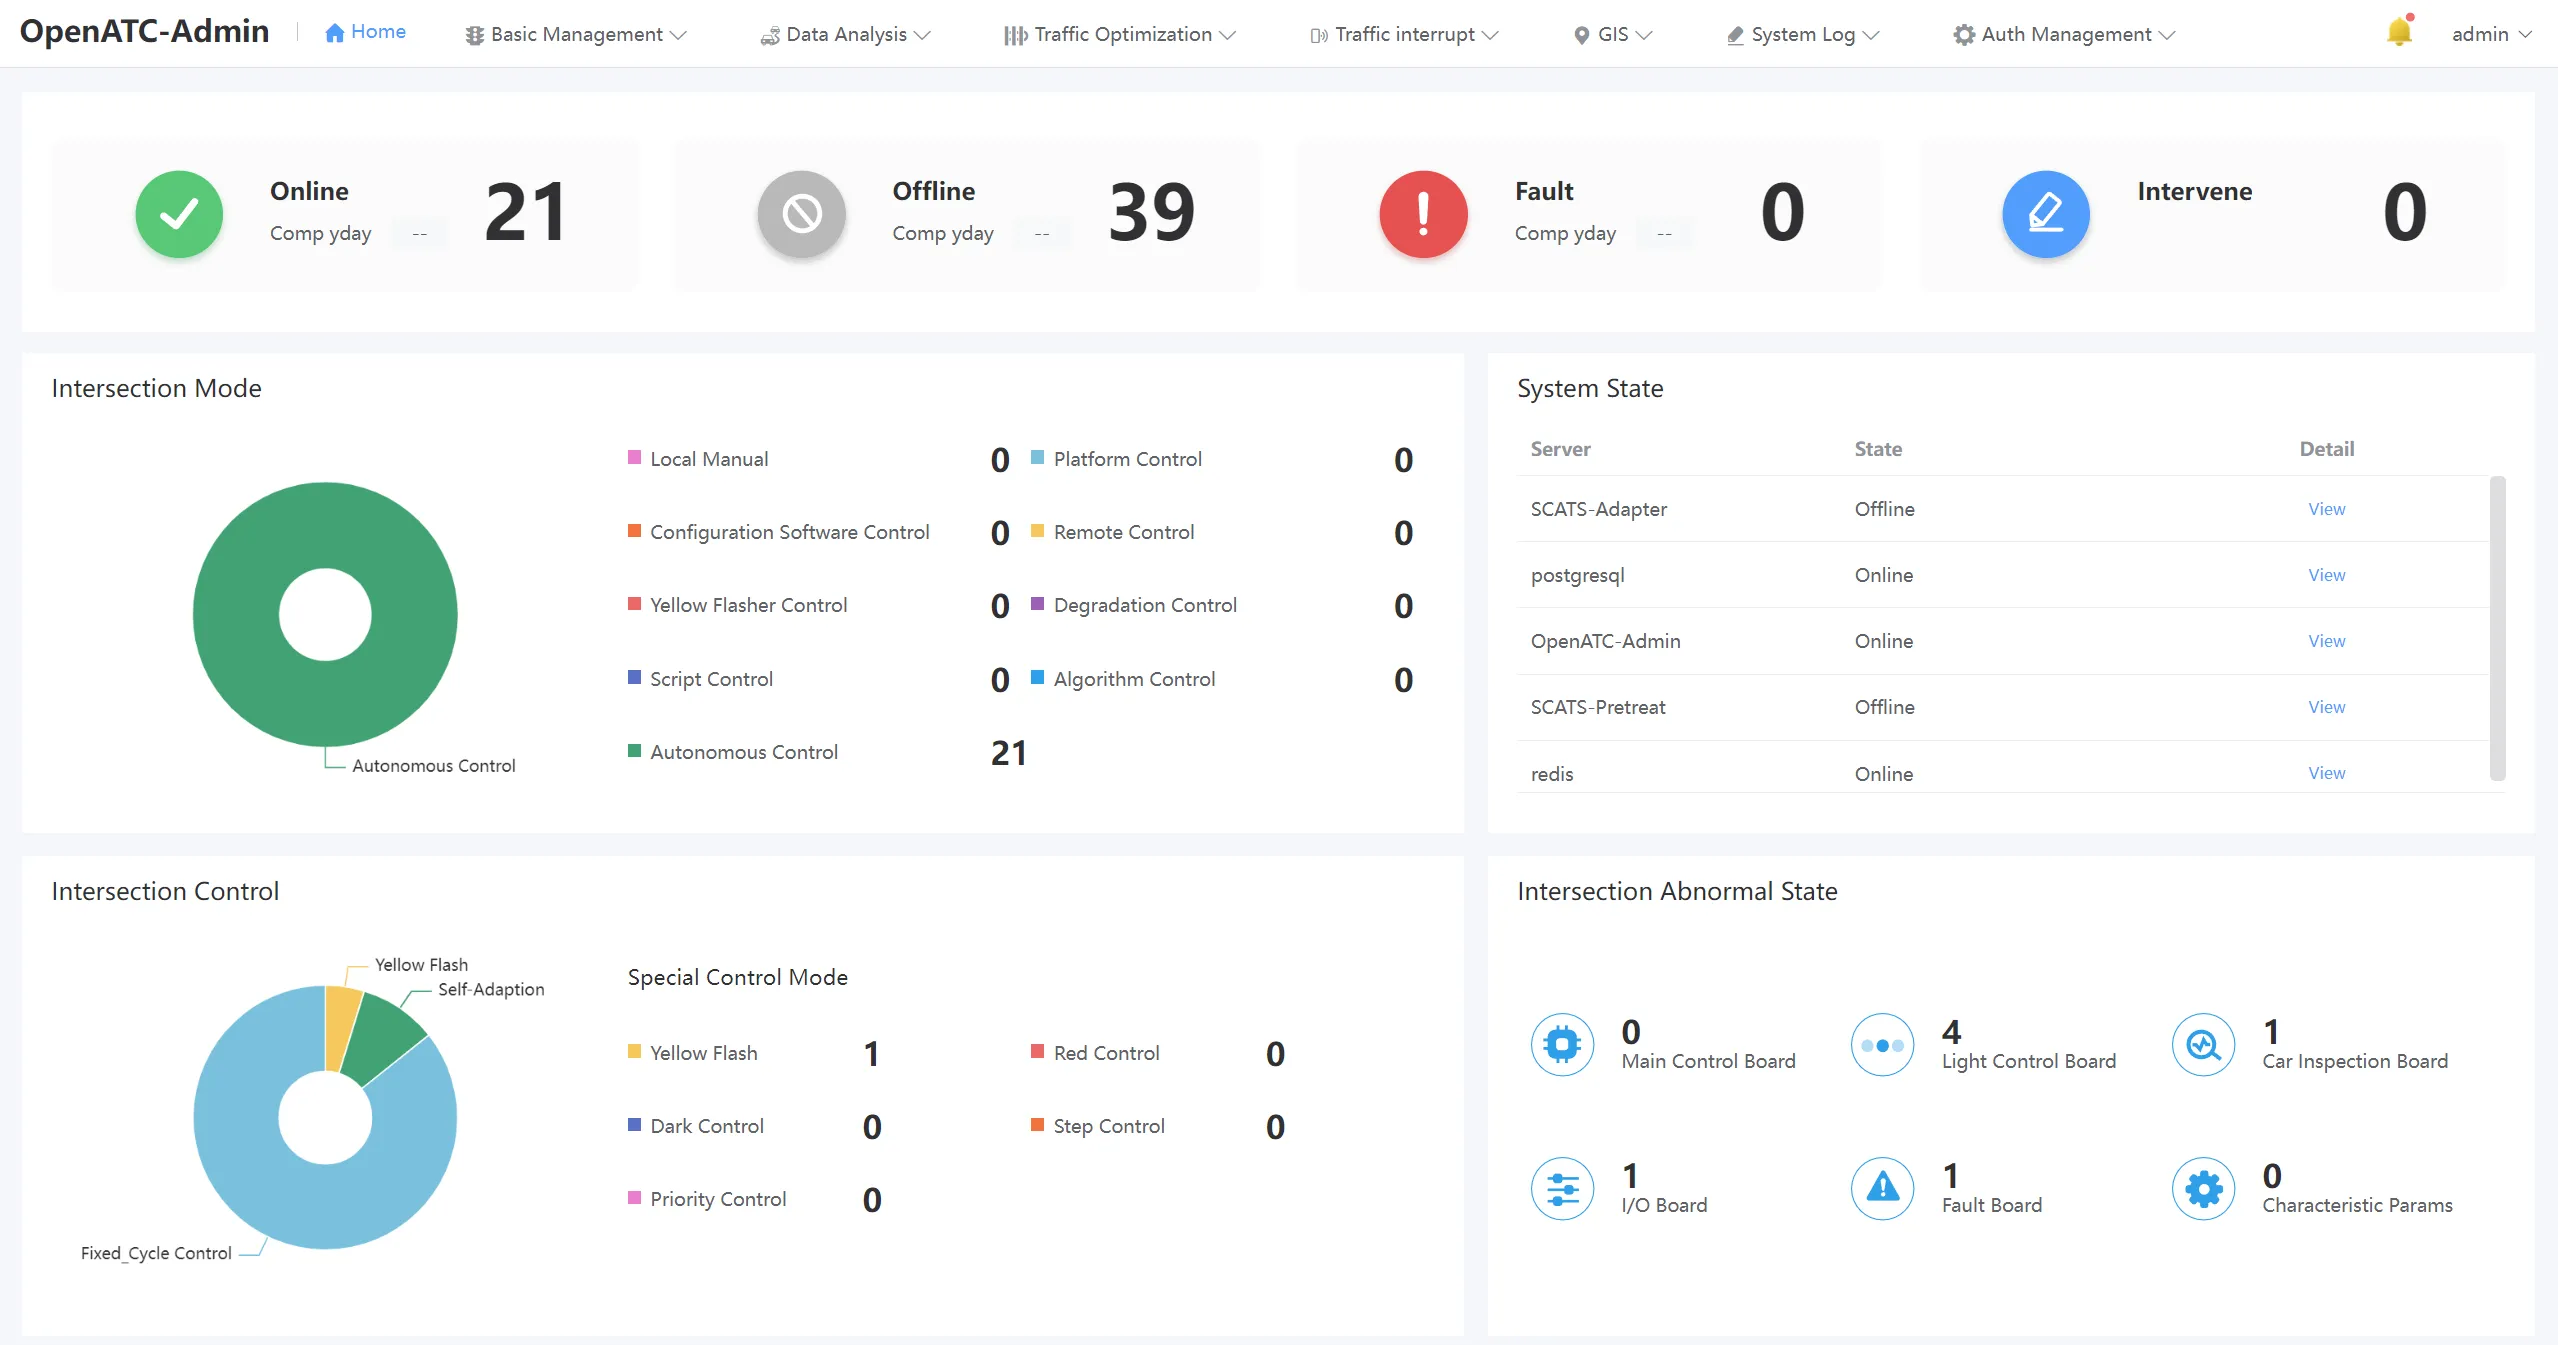
2.9 Home Page
On the home page, you can view the total number, online number, offline number, number of faults, fault information list, device management, user management, and operation records of the current device.
The home page also shows the number of additions and deletions comparing yesterday's online devices, offline devices, faulty devices, and intervention devices. Clicking on the number of devices in the corresponding status, the interface will jump to the intersection management interface, where you can view information such as intersection ID, intersection name, status, control mode and control mode, and perform operations such as editing and deleting.
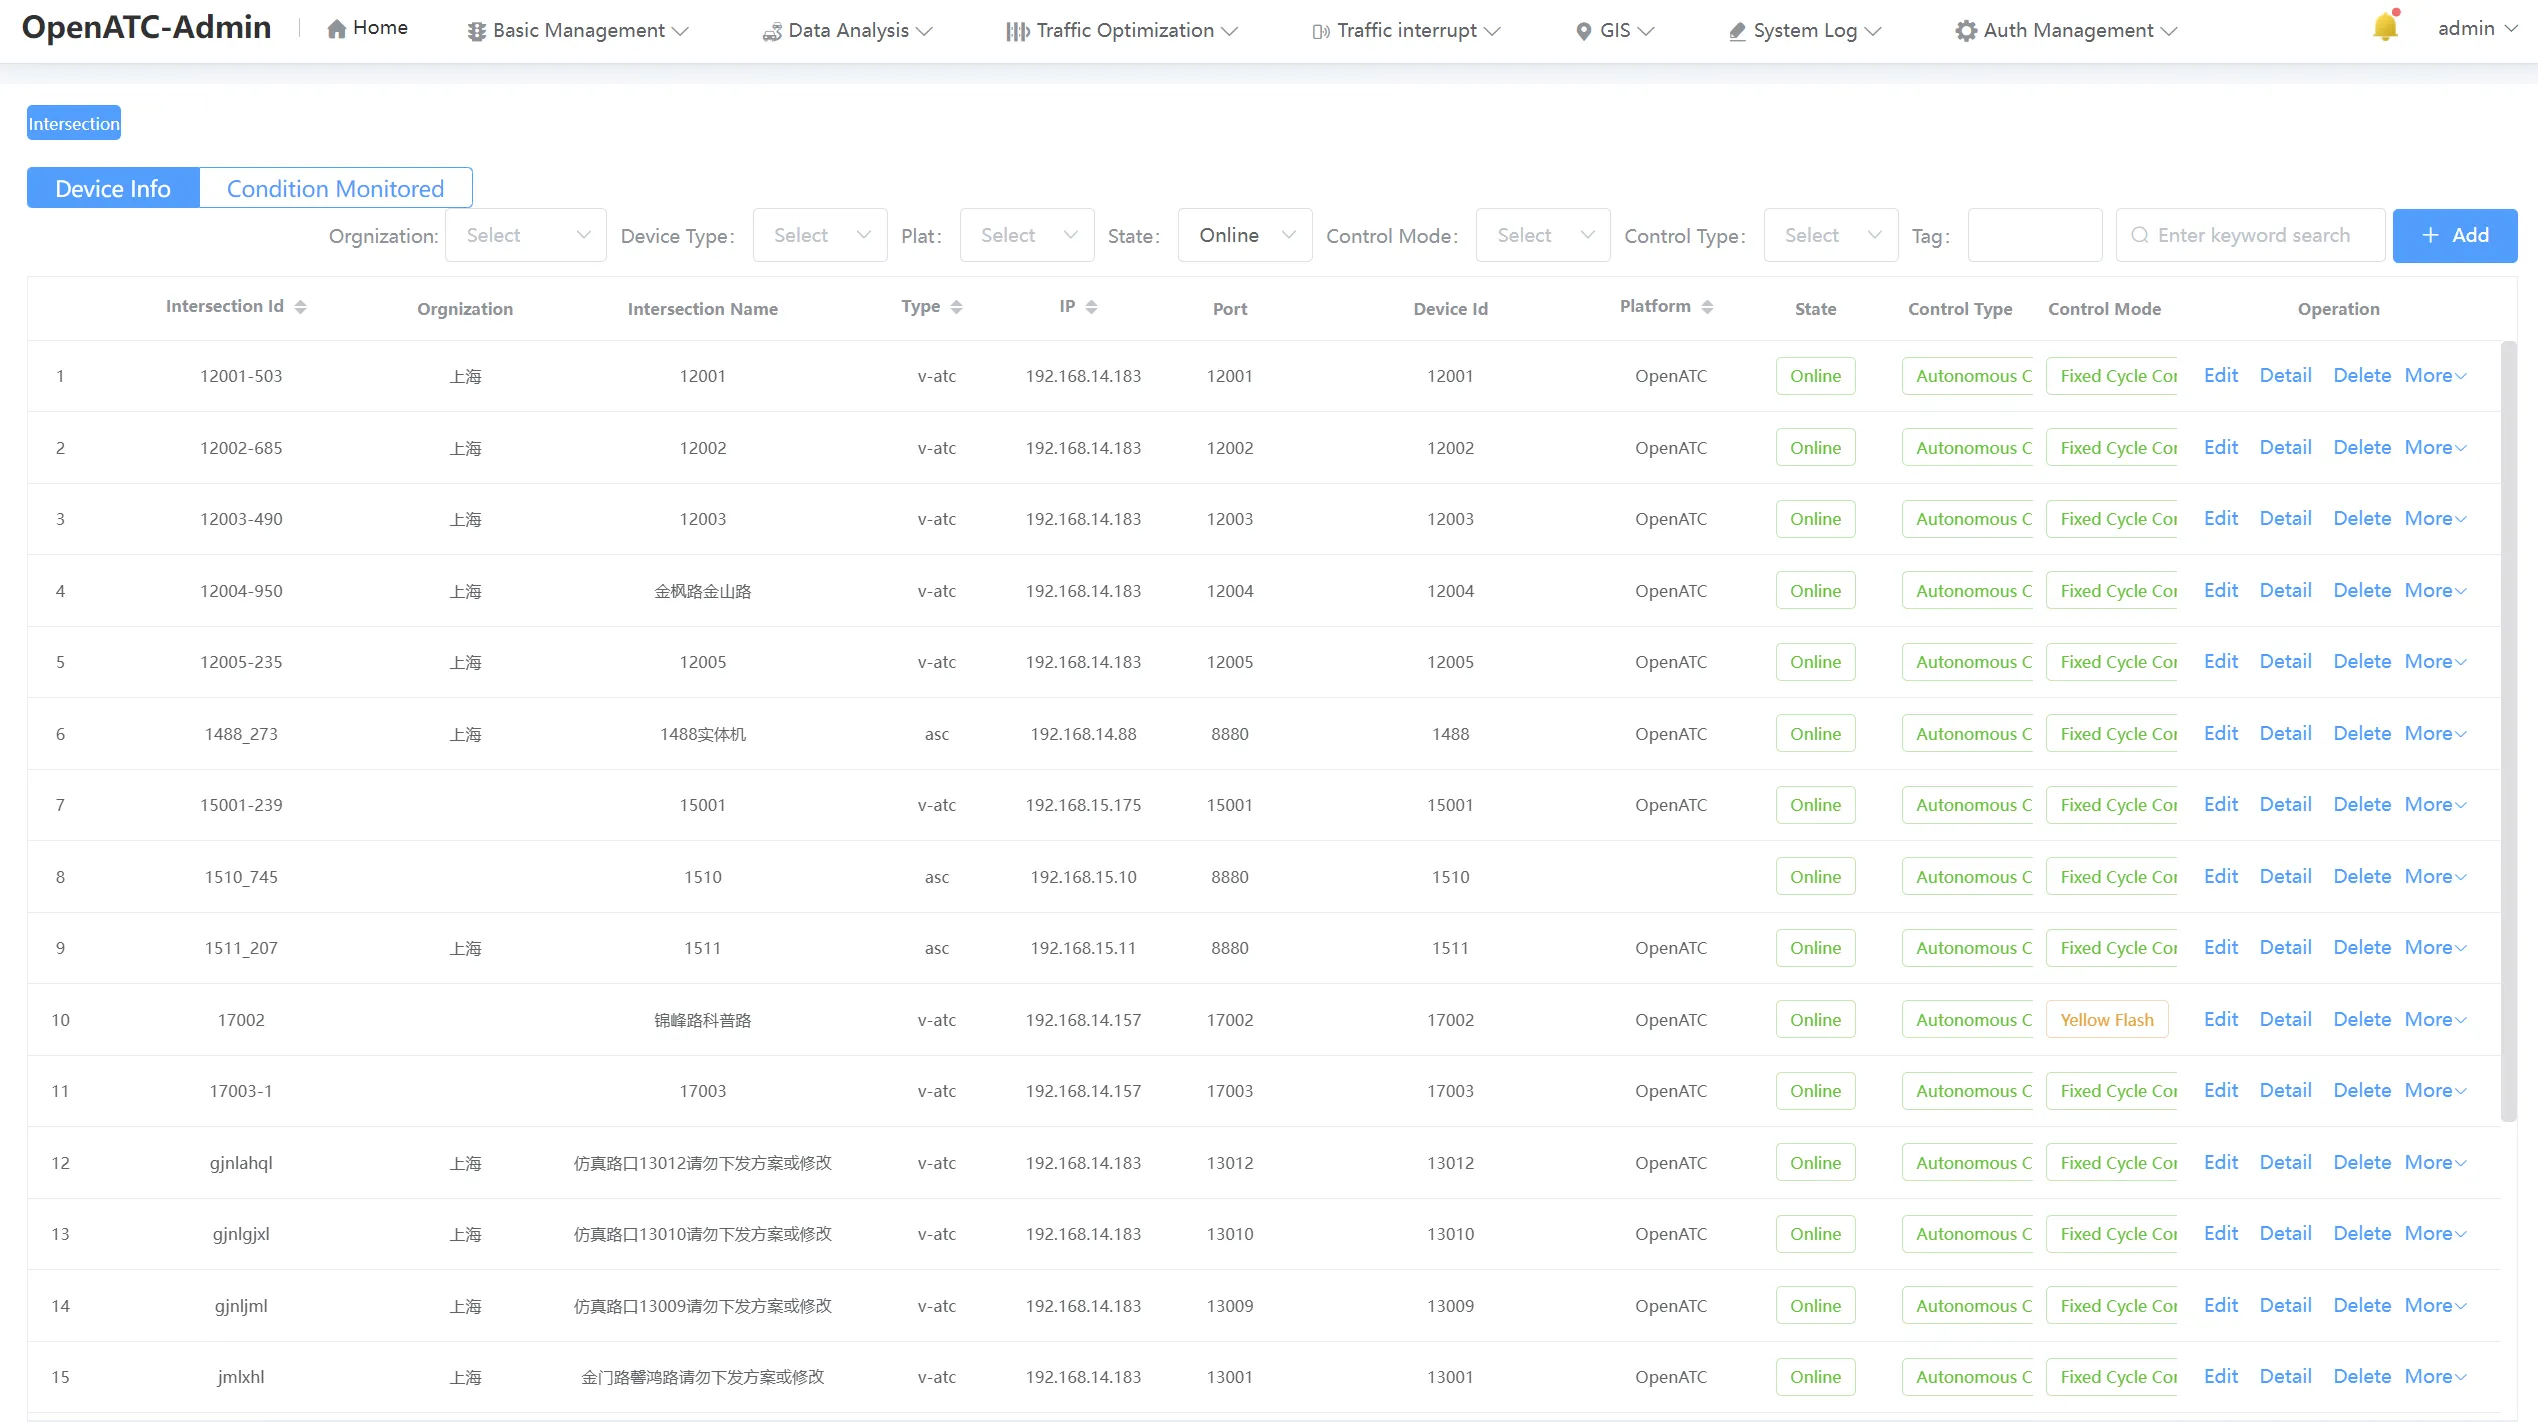
Click the number of devices corresponding to a certain control mode in the intersection control mode, the interface will jump to the intersection management interface, you can also view the intersection ID, intersection name, status, control mode and control mode information, edit, delete and other operations.
You can view the detailed information of each service in the system status.

Click the number of Devices corresponding to a certain control mode in the intersection control mode, the interface will jump to the intersection management interface, you can also view the intersection ID, intersection name, status, control mode and control mode information, edit, delete and other operations.
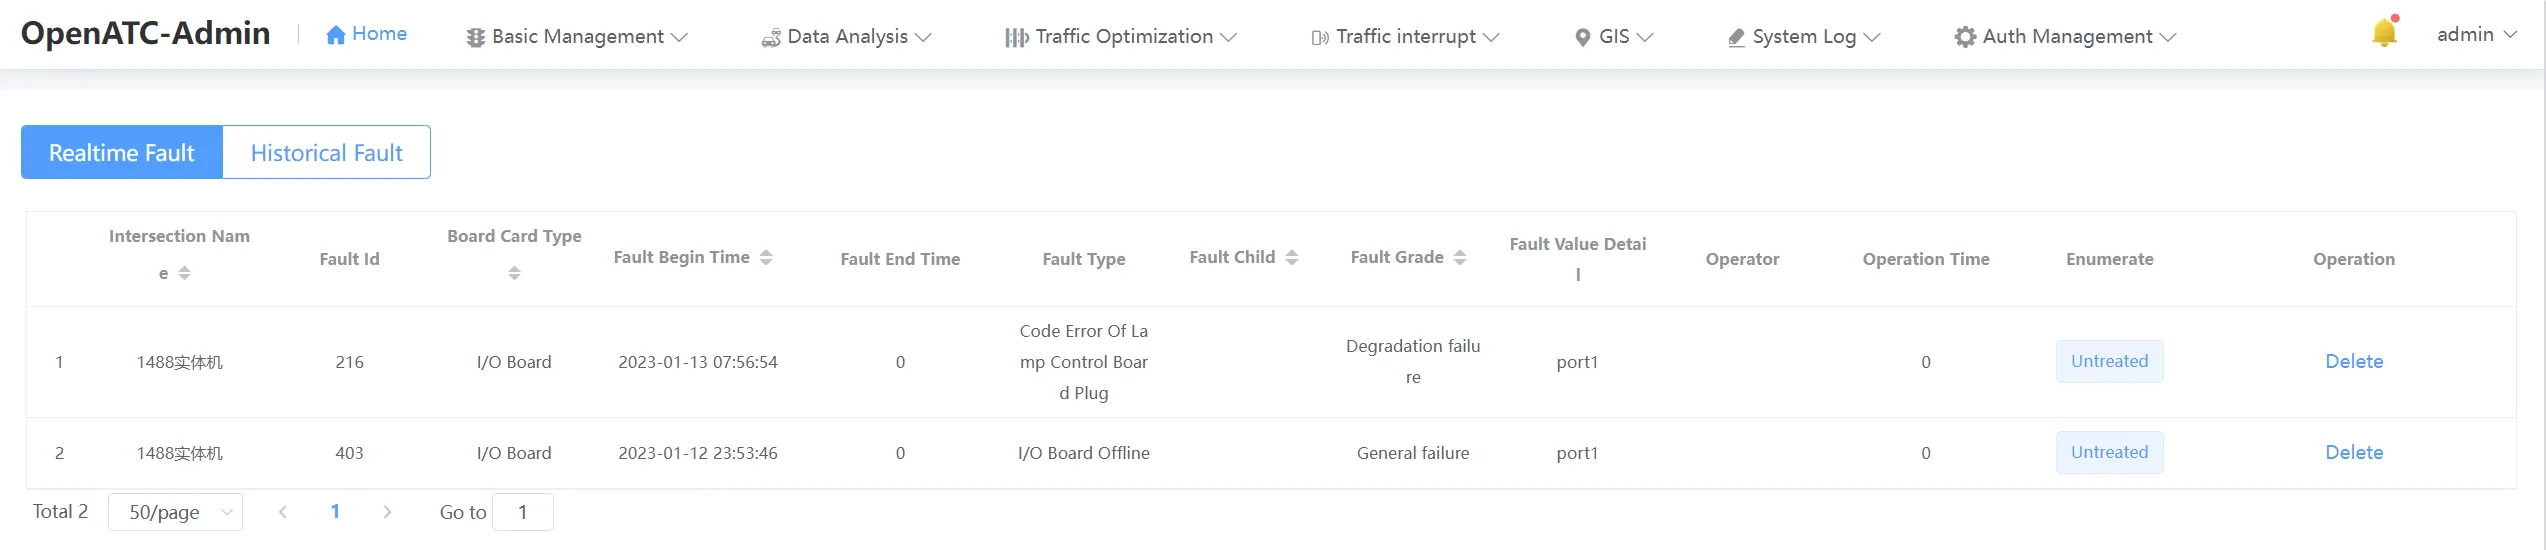
Click the number of devices corresponding to a board type in the abnormal status of the intersection, the interface will jump to the fault record - real-time fault interface, you can view the intersection name, fault ID, board type and time of occurrence, etc. You can view the fault confirmation results and perform deletion operations.